From cemeteries to video games — my research career spans academic anthropology, EdTech product strategy, and UX insights at a major game studio. I bring the same discipline to every domain: translate messy human behavior into decisions that move products forward.
Whether through segmentation, user feedback, or targeted interviews, I love turning tough questions into clear, practical next steps.
Whether you're building a research function, evaluating a new tool, or looking for someone comfortable at the intersection of qual, quant, and stakeholder storytelling — I'd love to talk.
Designing for Engagement
A research journey in active-learning innovation.
Prototype greenlit ✓
Instructor-led feature set
Iterative framework adopted
Interviews
Surveys
Concept testing
Thematic analysis
Discovery
Mapped instructor goals, friction points, and adoption constraints across business disciplines. Established problem framing and success criteria.
Exploratory survey + instructor advisory inputs informed the qualitative guide and prototyping plan.
Design
Multi-phase plan combining interviews, concept co-creation, and structured testing. Facilitated ideation with cross-functional partners to craft a pilot-ready active-learning prototype.
Testing
Moderated and async remote sessions with instructors; structured rubrics captured effectiveness, usability, and alignment to outcomes.
Refinement
Workshopped changes: clearer decision branching, better reflection checkpoints, streamlined visual scaffolding. Re-validated with a subset of instructors.
Impact
Prototype greenlit for full development. Delivered requirements to feed the roadmap; established an internal template for iterative research on instructional tools that was adopted across the team.
Evaluating the market viability of an AI-driven learning tool.
Pilot launched ✓
Roadmap inputs
Features prioritized
Focus groups
Live facilitation
Scenario testing
Synthesis
Scope
Partnered with product leads to assess demand for an AI-assisted active-learning solution for higher-ed. Prioritized use cases, risks, and success metrics.
Objectives
Validate educator interest & perceived value.
Surface adoption blockers & enabling conditions.
Define pilot requirements and guardrails.
Approach
Live concept walkthroughs, scenario evaluation, and facilitated discussions. Comparative ratings of alternative approaches + analysis of "jobs to be done."
Outcomes
Green-lighted pilot with constrained scope.
Prioritized features for MVP; deprioritized low-signal ideas.
Defined evaluation plan and instructor recruitment targets.
Skills & Tools
Study design, facilitation, synthesis, stakeholder alignment, roadmap inputs.
Created a cross-team framework to evaluate product experiences using consistent criteria — content quality, interaction quality, evidence quality, and outcomes alignment.
Timeline
Scoping & stakeholder alignment
Pilot evaluation across sample modules
Analysis & scoring calibration
Rollout as team standard
Scorecard
Weighted rubric and artifact checklist turned subjective reviews into consistent, comparable assessments across teams.
Impact
Framework adopted as the research team's standard for defining educational product quality at scale.
Shared definitions of "quality" improved cross-team decisions.
Surfaced high-risk experience debt and quick wins.
Reflections
The hardest part wasn't the methodology — it was getting alignment on what "good" actually meant across stakeholders with different priorities. The framework only works because that alignment happened first.
Phase 1 of an ongoing mixed-methods investigation into player retention at a major game studio.
Phase 1 complete
Churned players identified
Engagement drivers surfaced
R
Telemetry data
NLP classification
Social listening
Share of Voice
Overview
This project investigates why players disengage — combining behavioral telemetry with unsolicited player voice from public communities. Phase 1 focused on establishing who churned, when, and what players were saying about their experience during that window.
All specific findings, game titles, metrics, and player data are confidential. This overview describes the research approach and methodology only.
Telemetry analysis
Raw behavioral data was cleaned and structured in R — handling missing values, normalizing session metrics, and constructing engagement timelines per player cohort. Analysis identified churn windows and the behavioral signatures that preceded disengagement.
Visualizations built in R translated raw session patterns into stakeholder-readable engagement curves, surfacing where in the player journey drop-off concentrated.
Social listening
Player sentiment was captured from public community platforms — forums, review hubs, and community discussion boards — aligned to the churn windows identified in the telemetry data.
NLP classification was applied to categorize posts by topic and sentiment. Share of Voice (SoV) analysis surfaced which themes dominated player discourse during key retention windows, providing an unsolicited, unmoderated signal to complement the behavioral data.
Synthesis
Telemetry patterns and social listening themes were triangulated to identify candidate engagement drivers — areas where behavioral drop-off and player-reported frustration or disengagement overlapped. This intersection gives the team a prioritized list of hypotheses to investigate rather than a flat list of complaints.
Outputs are being prepared for presentation to developers, product leaders, and cross-functional stakeholders to inform future research priorities and product decisions.
Next phases
Phase 1 surfaces the "what" and "when" of churn. Subsequent phases will validate the engagement drivers identified here — likely through targeted player interviews and survey-based confirmation — before moving to intervention design.
The phased structure ensures that qualitative depth is applied where it matters most, rather than spread thin across every hypothesis the data generates.
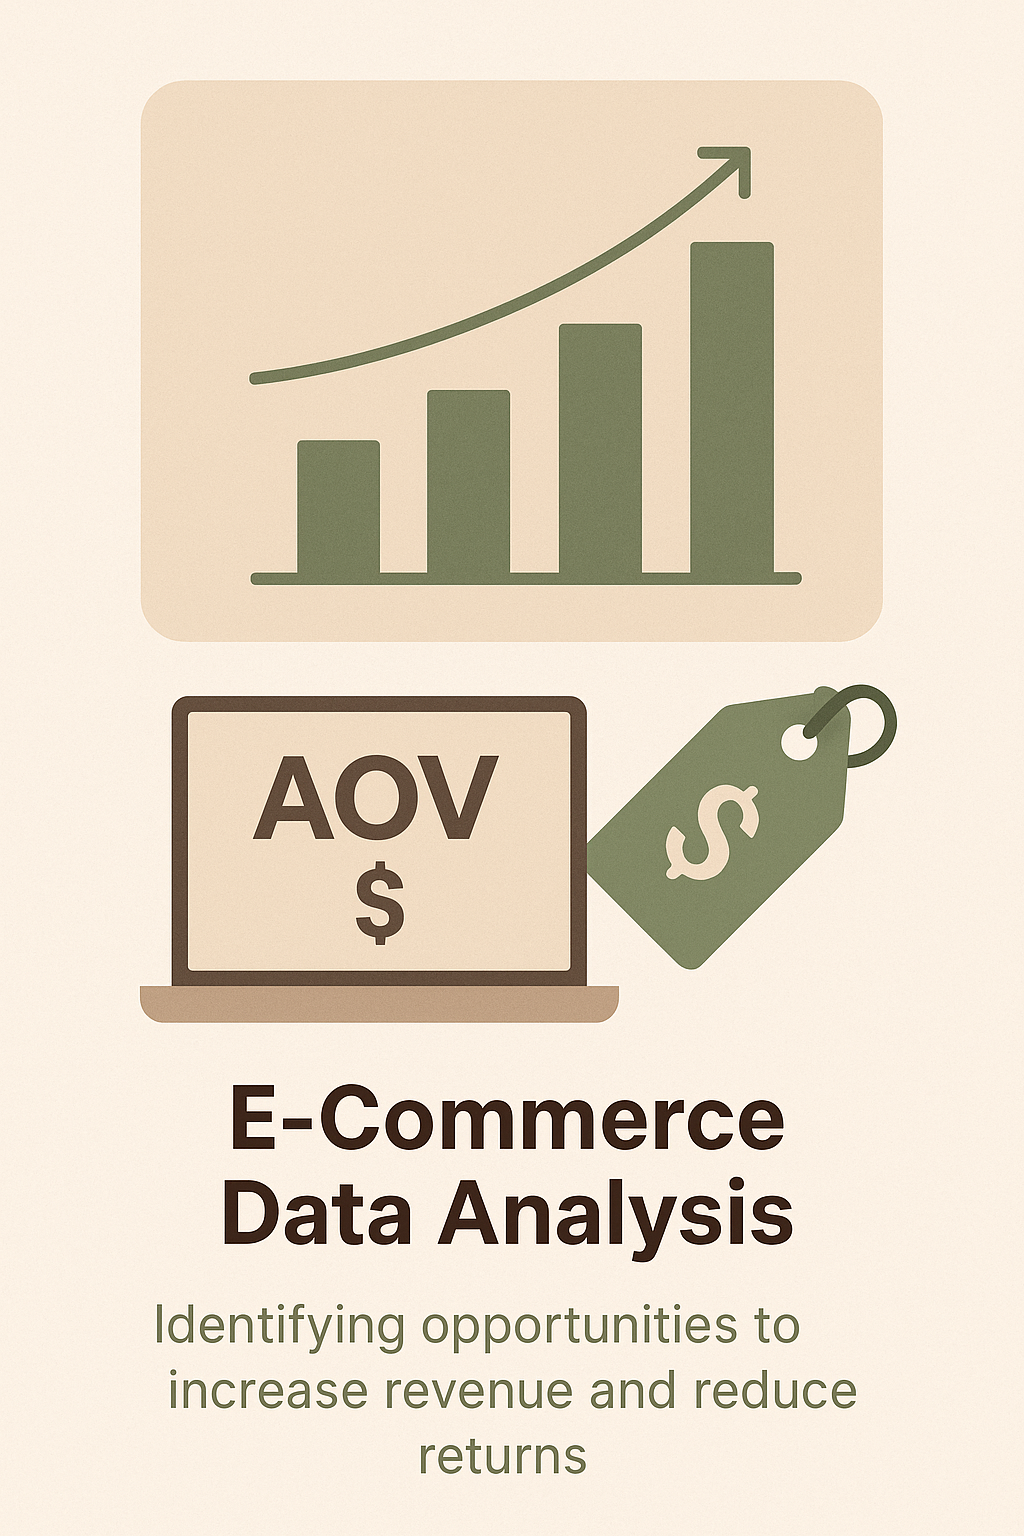
Python → SQL → Power BI demonstration on a simulated dataset.
Python
MySQL
DAX
Power BI
Overview
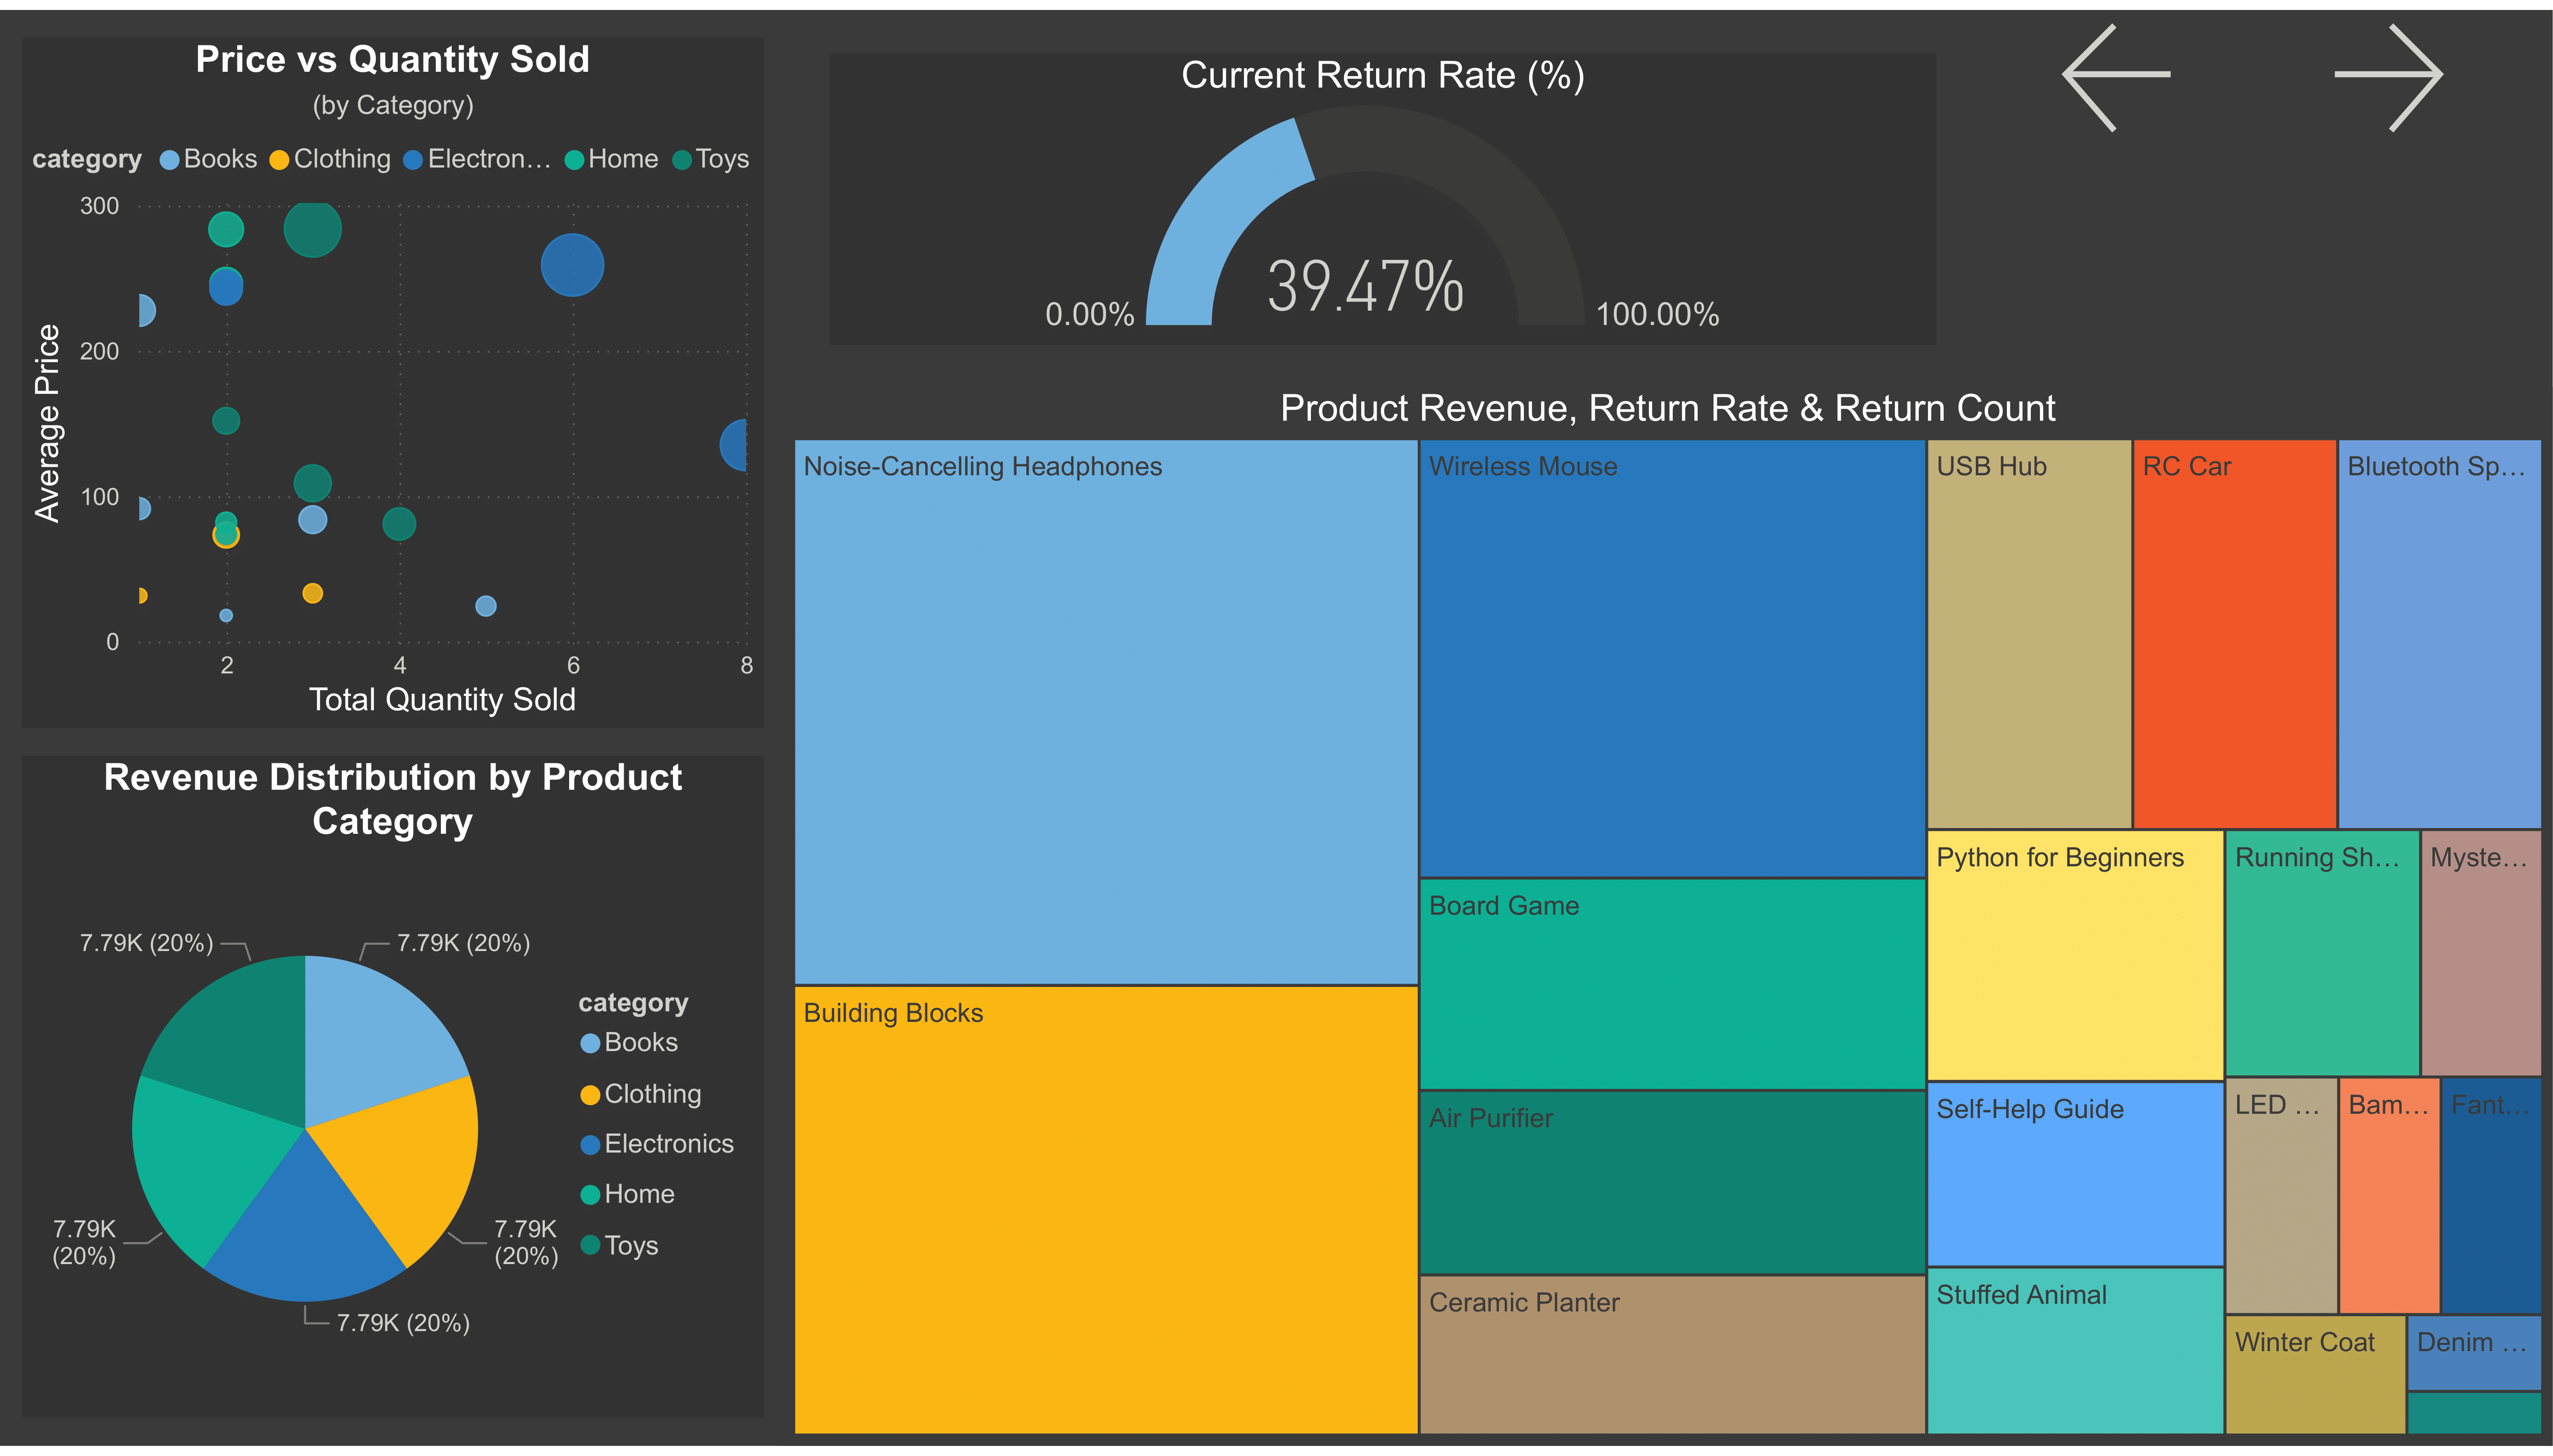
Built a self-directed end-to-end analytics pipeline — simulated transactions in Python, analyzed in SQL, and visualized in Power BI — to build hands-on fluency with the tools that sit alongside research work.
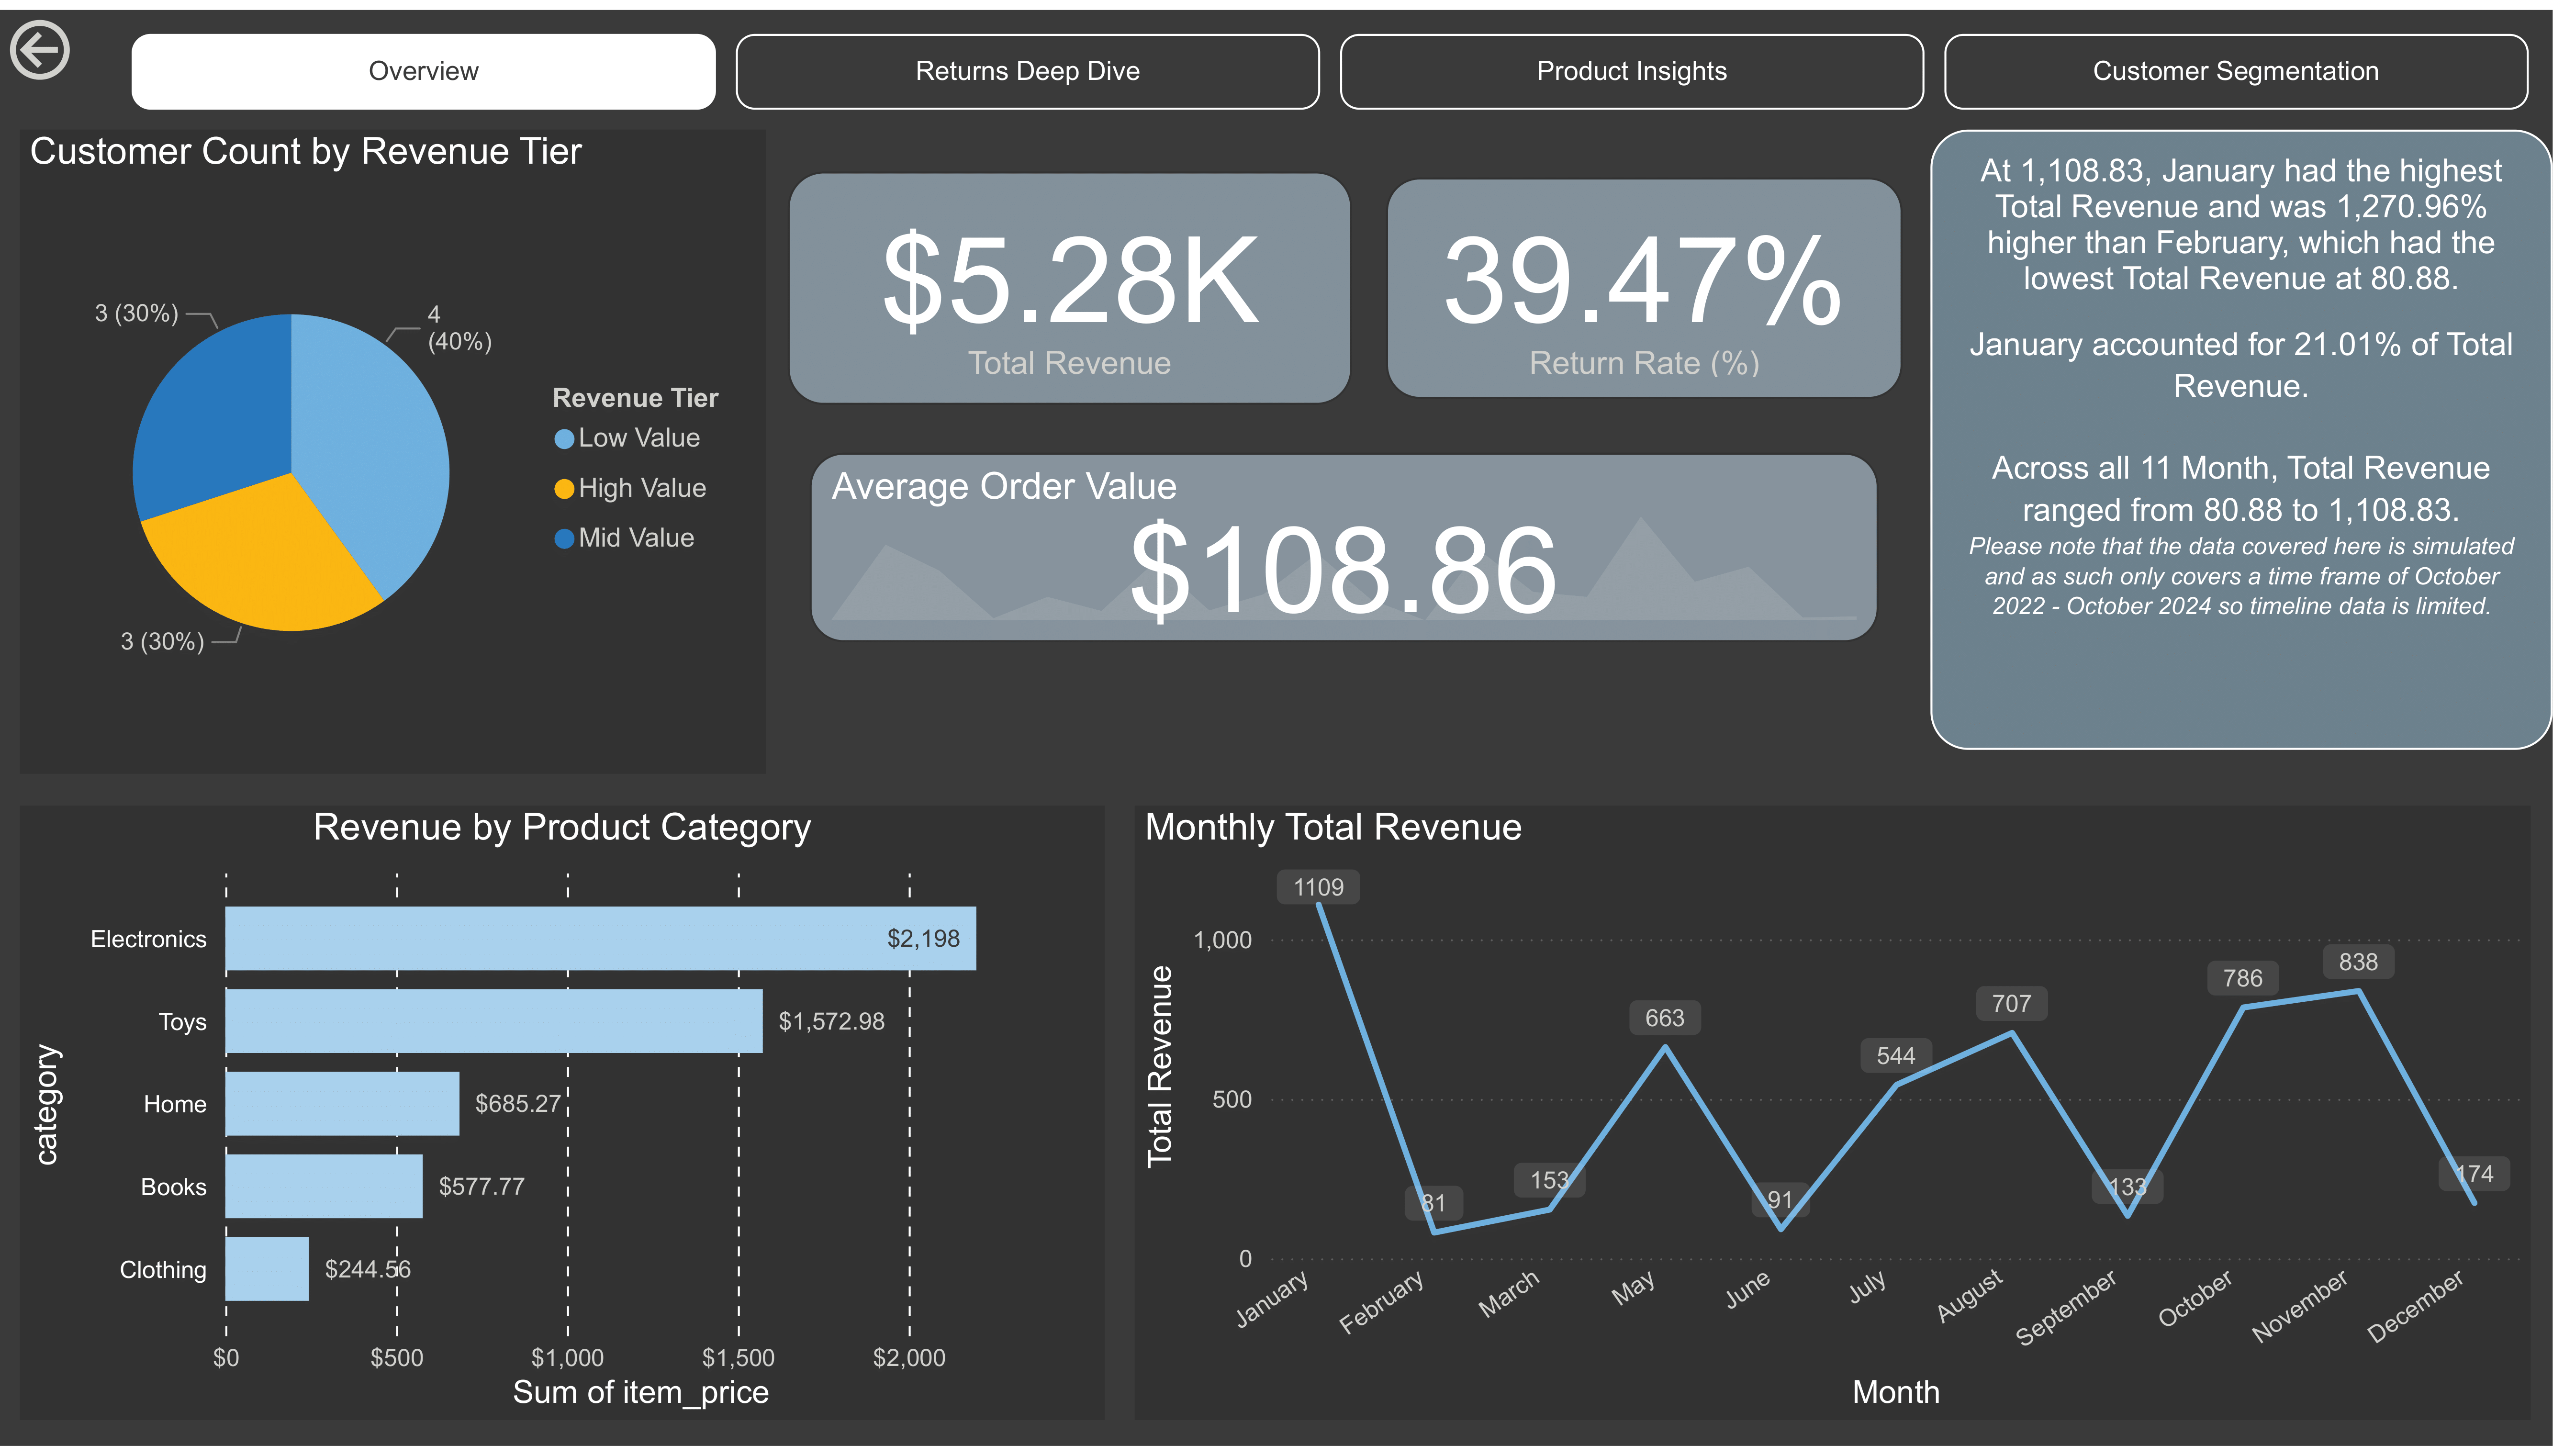
Key metrics
Total revenue (sample): $5.28K
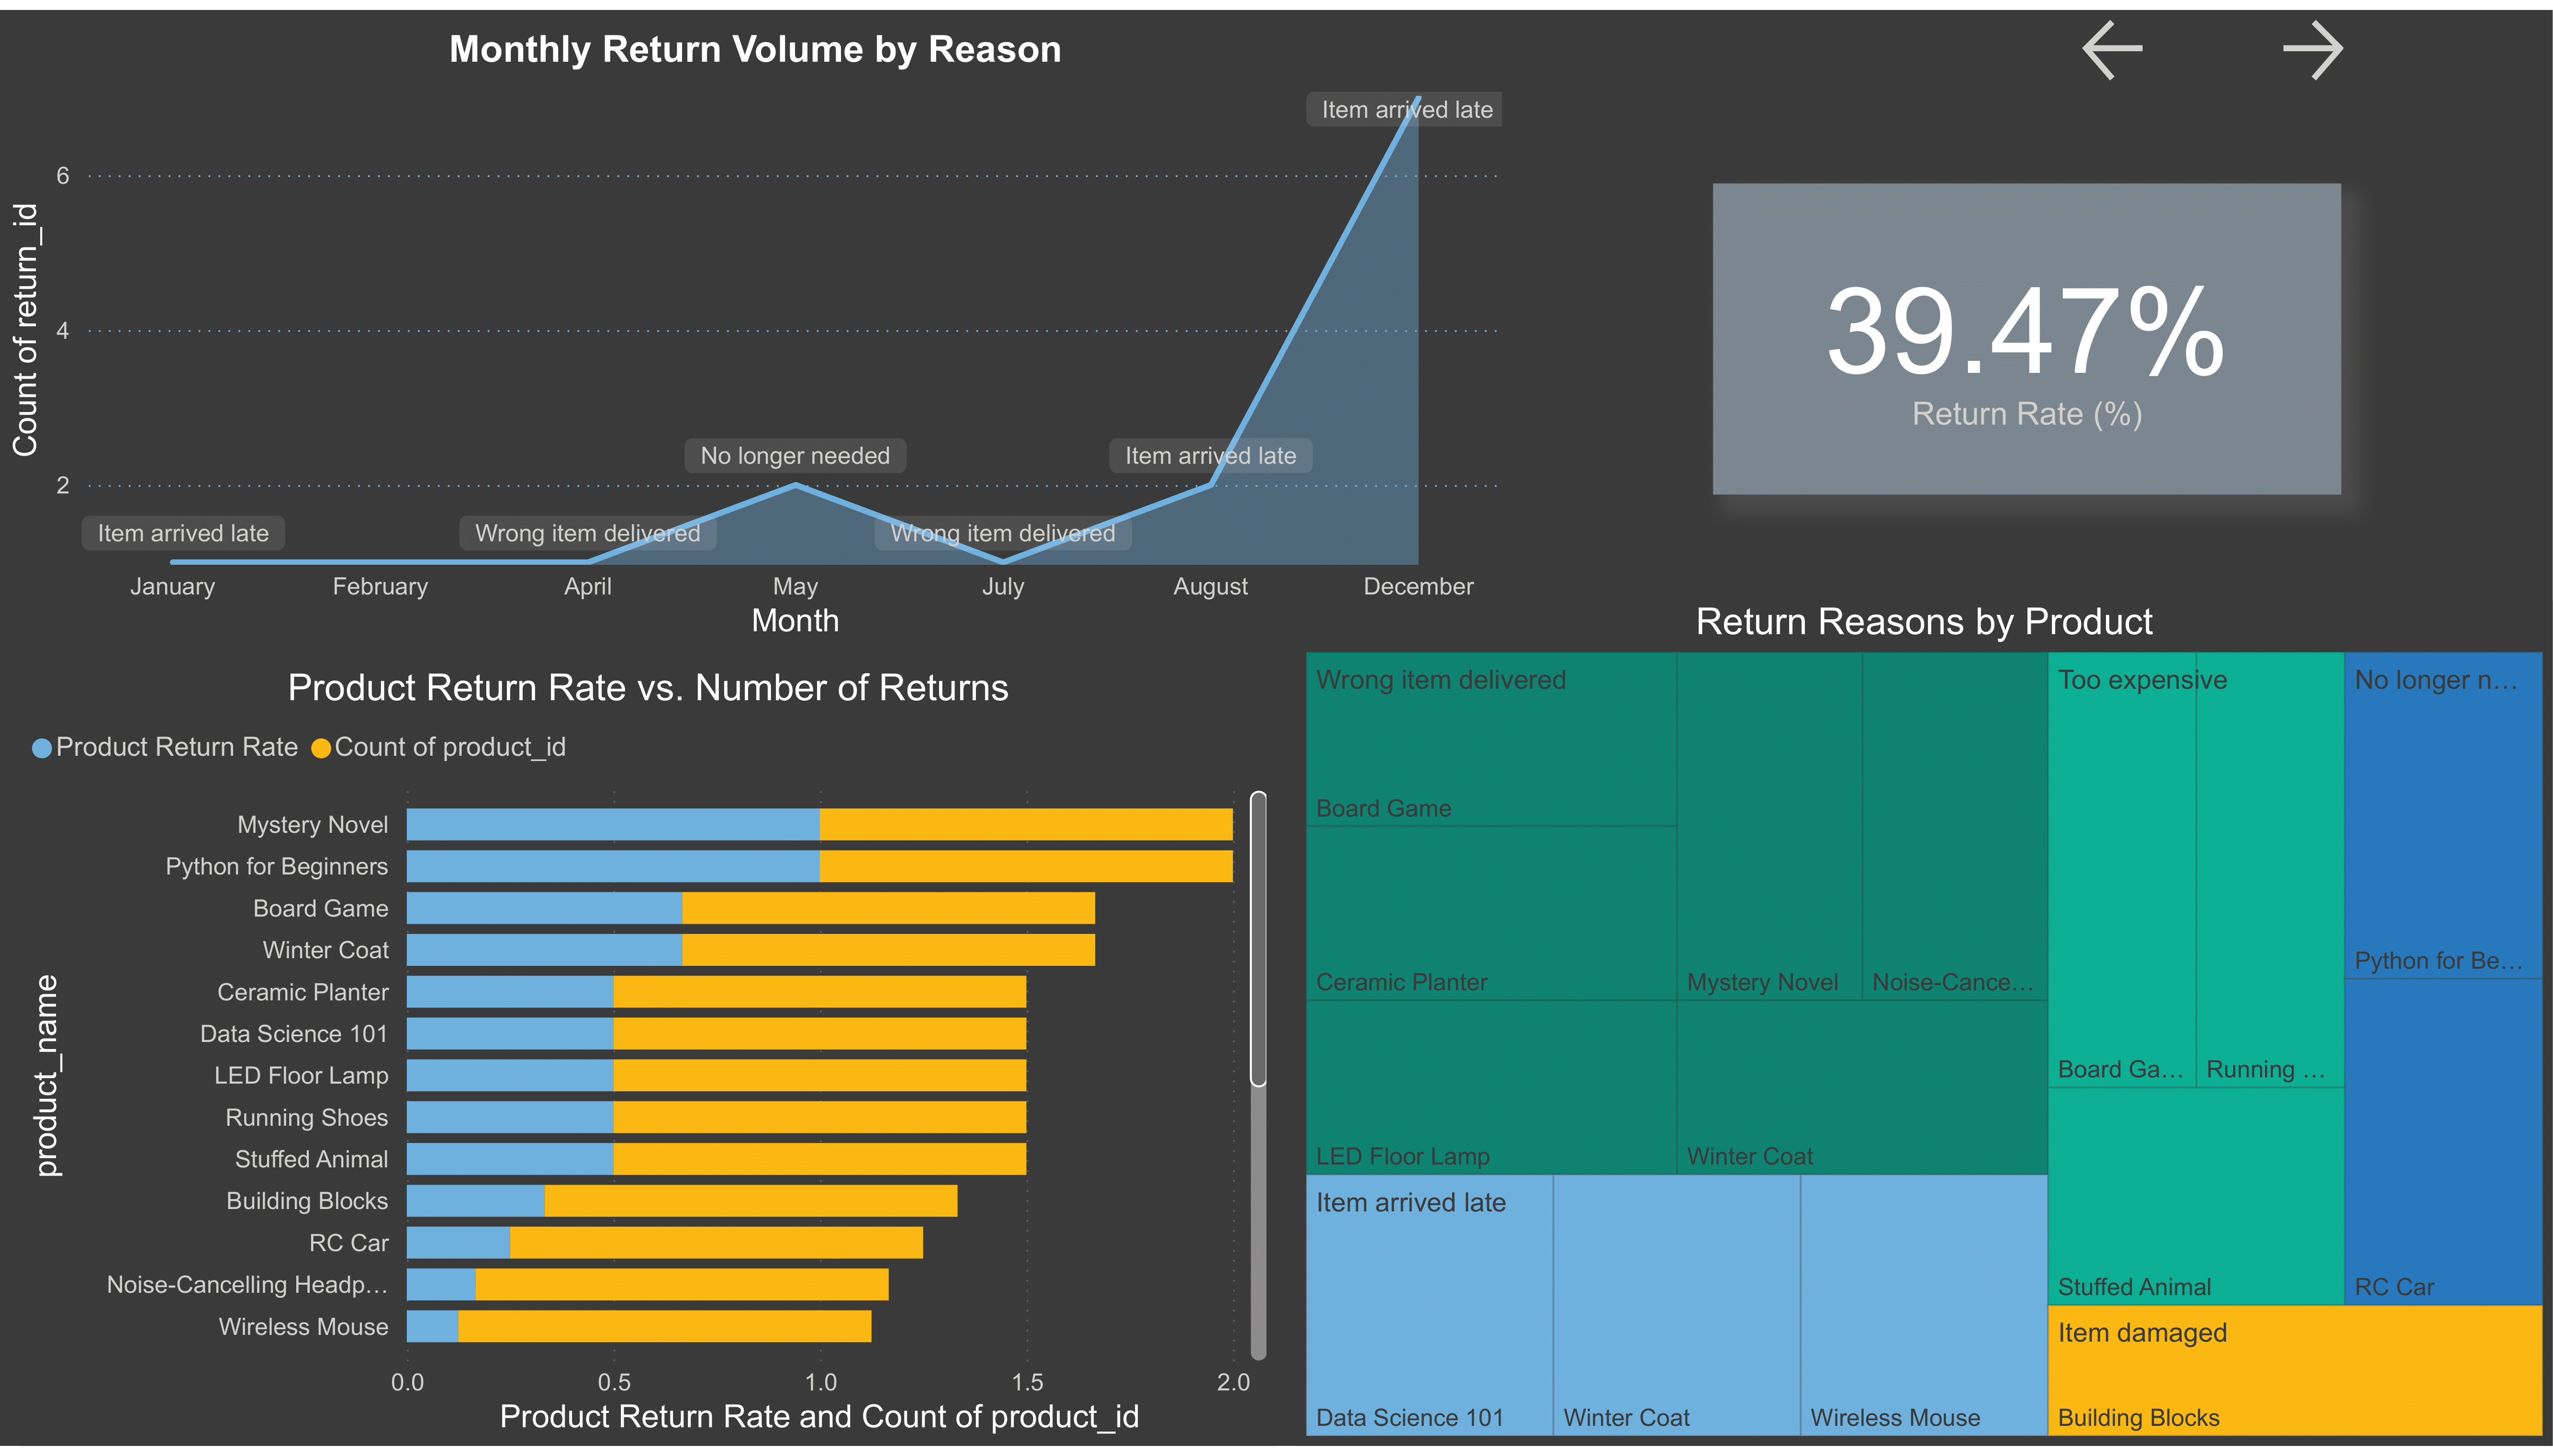
Return rate: 39.47%
Avg order value: $108.86
Top revenue: Electronics
What I learned
Data structure decisions upstream affect every analysis downstream
CLV & return-rate calculations in DAX — small denominator choices change the story
Designing static reporting requires more restraint than interactive dashboards
Main dashboard: revenue, AOV, returns, category performance.
Revenue & returns by month: trend inspection.
Product insights: price–quantity and revenue distribution.
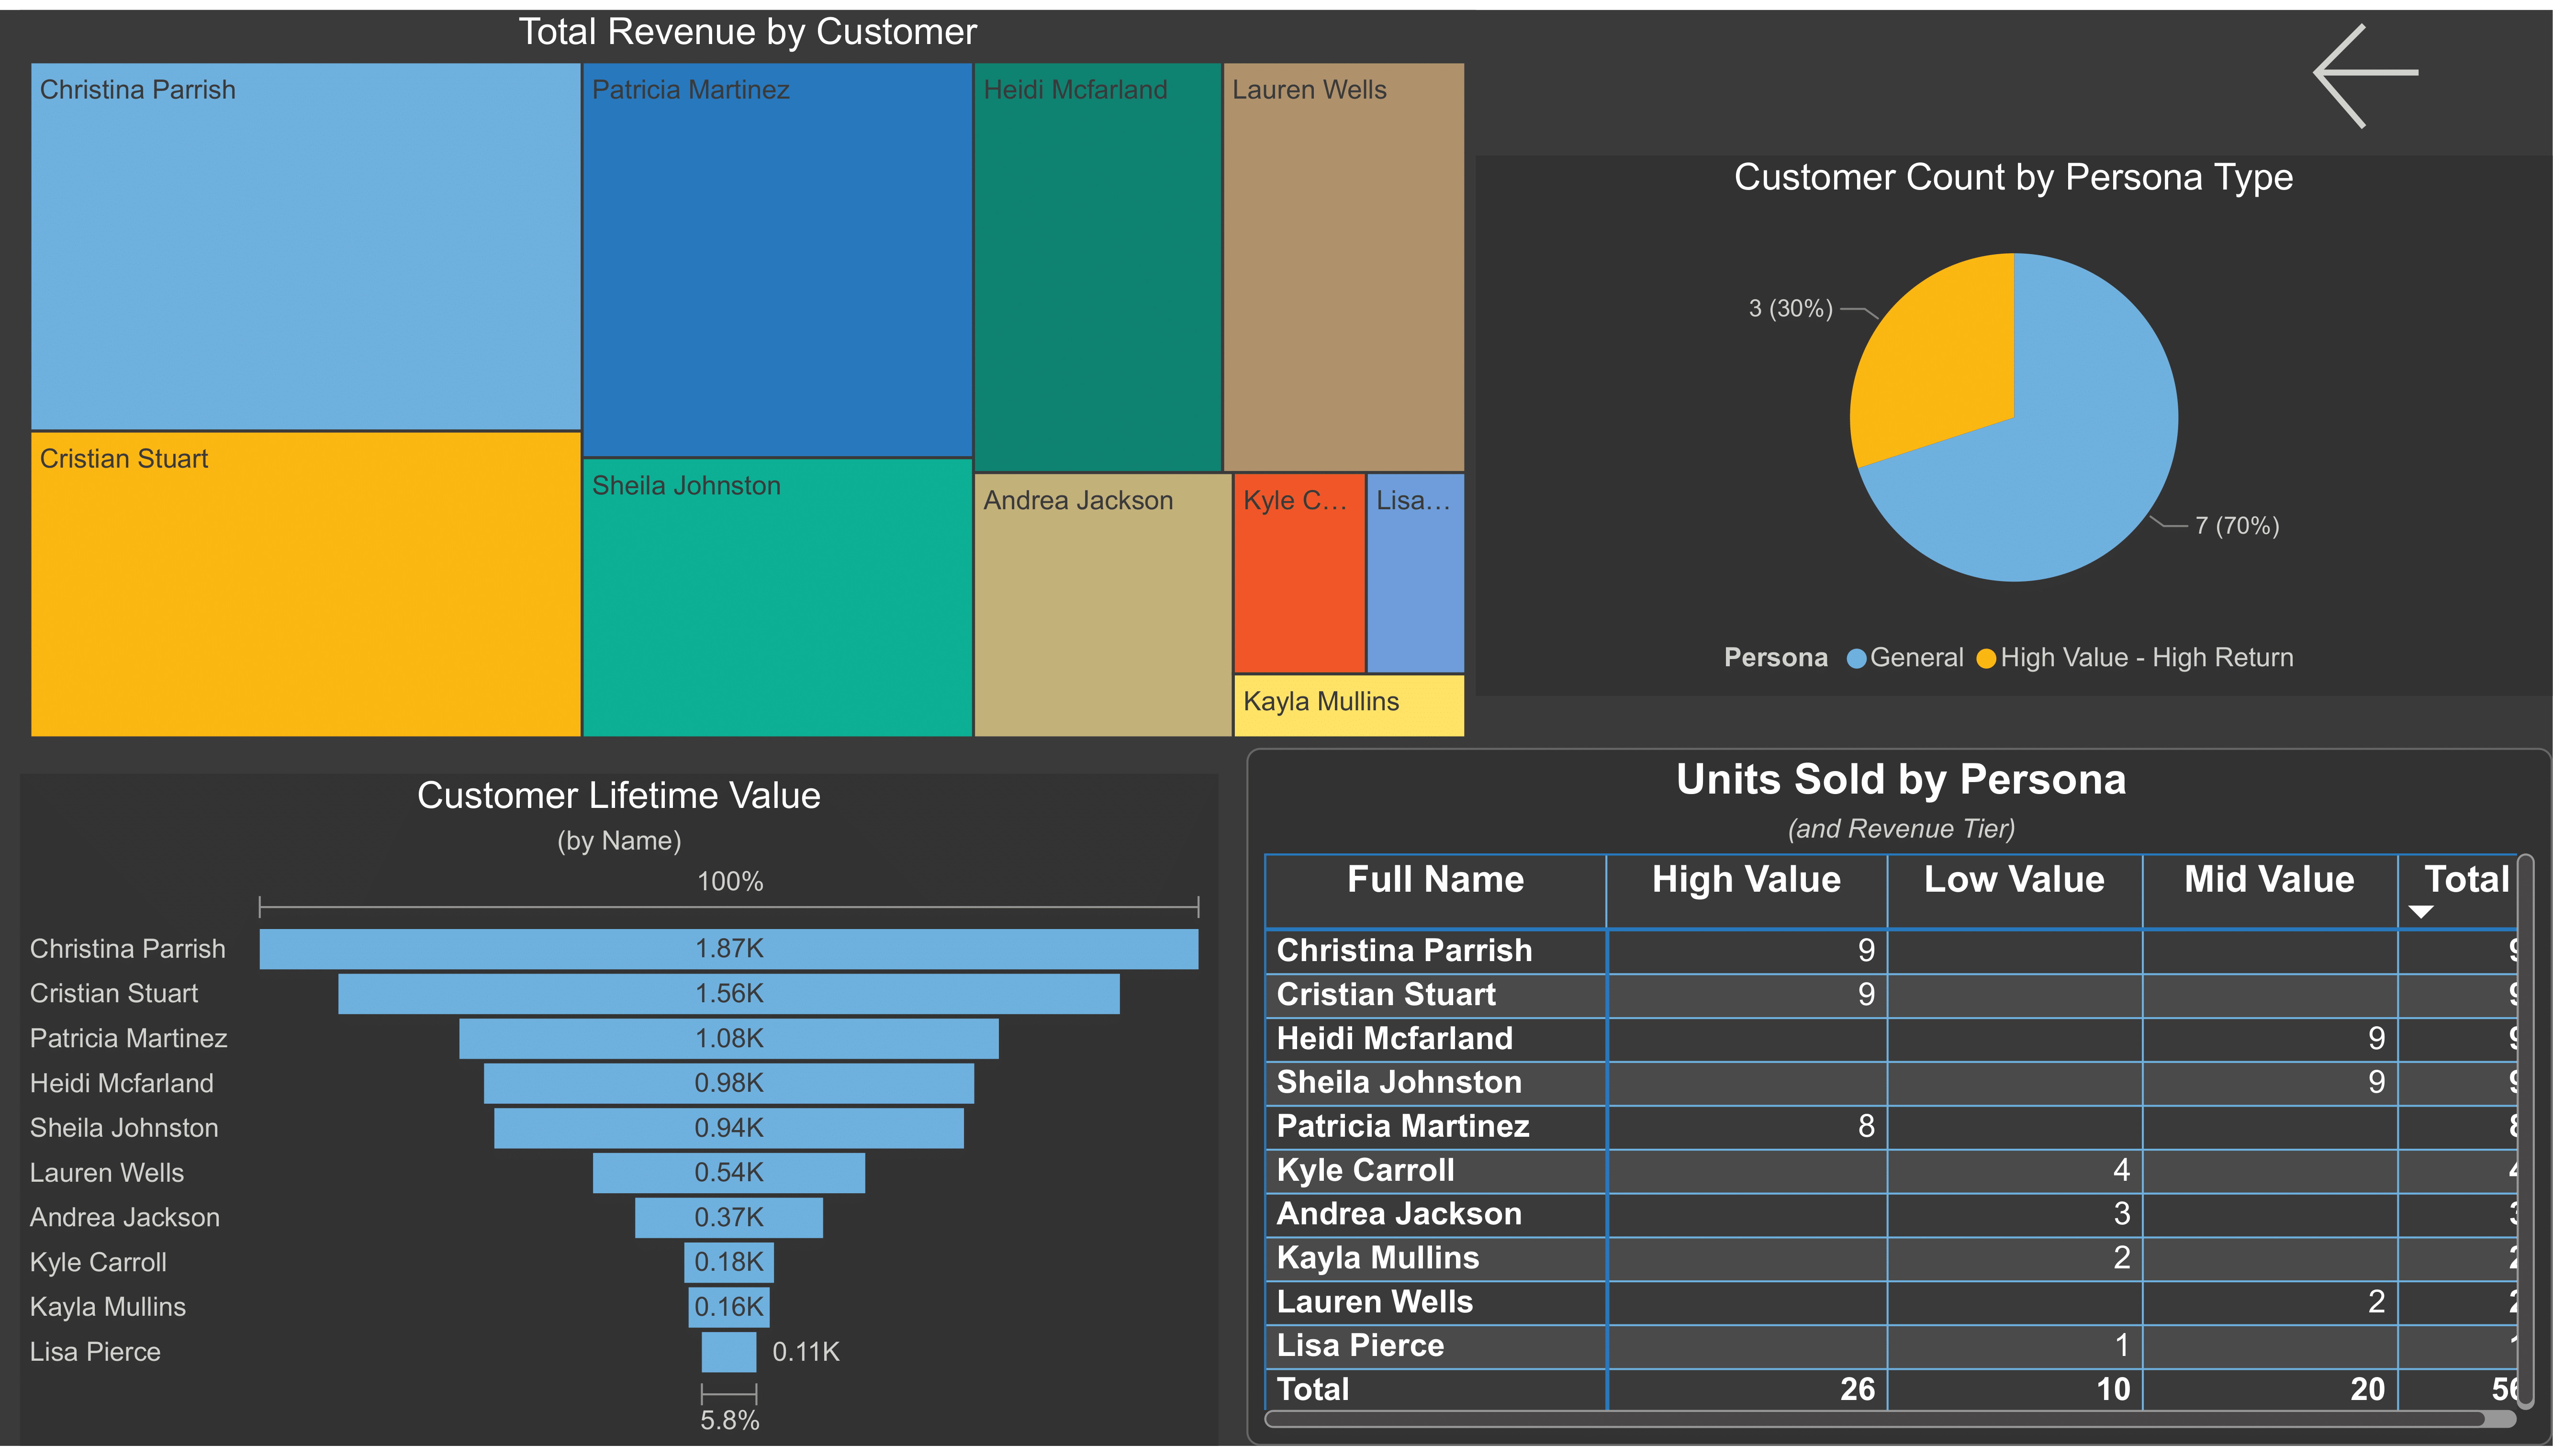
Customer segmentation: lifetime value and persona tiers.